Code Coverage Testing for C++
Do you have unit tests for your code? Yes? Awesome!
Do you know how much of your code is executed by your tests? No?
Aww, don’t feel bad!
This is what code coverage testing is for: it gives you detailed information on how much of your code base is covered by your test suite.
This post describes how to add code coverage testing to your C++ project. I’m assuming you are using CMake as build system and GCC or Clang as compiler.
What’s Code Coverage?
Code coverage tells you which parts of your code are executed by your test suite and—even more important—which parts are not. The coverage rate is typically specified as a percentage of files, functions, blocks, or lines being covered.
Code coverage works by instrumenting your code so that the resulting executable will generate statistics on which code paths are executed how many times. You can visualize the coverage information in different forms, such as a HTML report, in your CI system, or your IDE.
Why Use Code Coverage?
The main goal of code coverage testing to provide insight which parts of your code get tested. This increases confidence in your test suite. You can make sure that important code paths are properly executed by your tests. It shows if all branches are triggered or if there are corner cases left untested.
A second advantage is that it helps to avoid redundancy. Without any information which code is triggered by a test, you are likely to run certain code paths over and over again. This contradicts the goal of having a test suite that runs fast, which is a key requirement for efficient testing.
Getting Started
I’ll proceed in three steps:
- Command line usage
- CMake integration
- Continuous integration
For command line usage, I’ll use the Gcov code coverage analysis tool. Both GCC and Clang can generate profiling information that can be processed by Gcov.
Let’s start with this simple example C++ code:
#include <cassert>

int max(int a, int b) {
    if (a > b) {
        return a;
    }
    return b;
}

int main() {
    assert(max(1, 0) == 1);
}
Compile this with the -coverage flag to tell the compiler to instrument the code:
clang++ -O0 -coverage test.cpp && ./a.out
Note that disabling optimizations is required to get reliable coverage results, hence the -O0 flag. After running the test program, you’ll see two additional files being generated:
$ ls test.*
test.cpp        test.gcda       test.gcno
The .gcda and .gcno files contain the coverage data. Now run gcov to process the results:
$ gcov test.cpp
File 'test.cpp'
Lines executed:87.50% of 8
Creating 'test.cpp.gcov'
Nice! This tells us that we already cover 87.5% of our lines of code. Not too bad, but there’s room for improvement.
The resulting test.cpp.gcov file gives a more detailed breakdown which lines have been executed how many times:
        -:    0:Source:test.cpp
        -:    0:Graph:test.gcno
        -:    0:Data:test.gcda
        -:    0:Runs:1
        -:    0:Programs:1
        -:    1:#include <cassert>
        -:    2:
        1:    3:int max(int a, int b) {
        1:    4:    if (a > b) {
        1:    5:        return a;
        -:    6:    }
    #####:    7:    return b;
        1:    8:}
        -:    9:
        1:   10:int main() {
        1:   11:    assert(max(1, 0) == 1);
        1:   12:}
Not surprisingly, our little test here does not trigger all branches of the max() function. Let’s fix that by adding another assertion:
int main() {
    assert(max(1, 0) == 1);
    assert(max(0, 1) == 1);
}
This bumps up our line coverage to 100%:
$ gcov test.cpp
File 'test.cpp'
Lines executed:100.00% of 9
Creating 'test.cpp.gcov'
Next, let’s have a look how to visualize this information in a more accessible manner.
Generate a HTML Report
Checking code coverage for a simple example like above is easy. However, for a larger project you want something to visualize the coverage information in a more convenient manner. In particular, identifying parts of the code which are not yet covered is important.
This is where lcov comes in: it is a graphical fronted to your coverage data. In particular, you can use it to generate HTML reports. This is done in two steps. First, run lcov in the directory with the coverage information:
lcov --directory . --capture --output-file coverage.info
Then generate the HTML files:
genhtml --demangle-cpp -o coverage coverage.info
Open the resulting coverage/index.html file in a browser of your choice and you’ll see an overview like this:
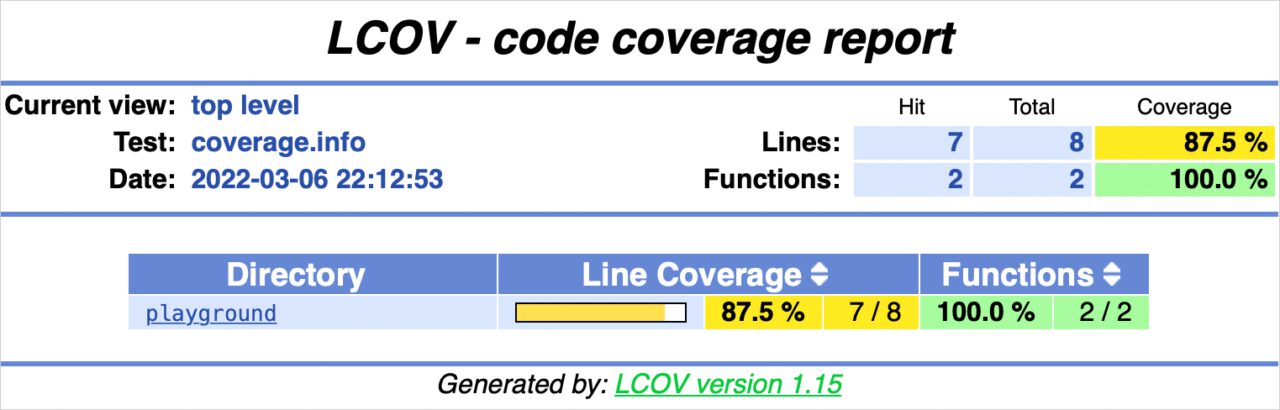
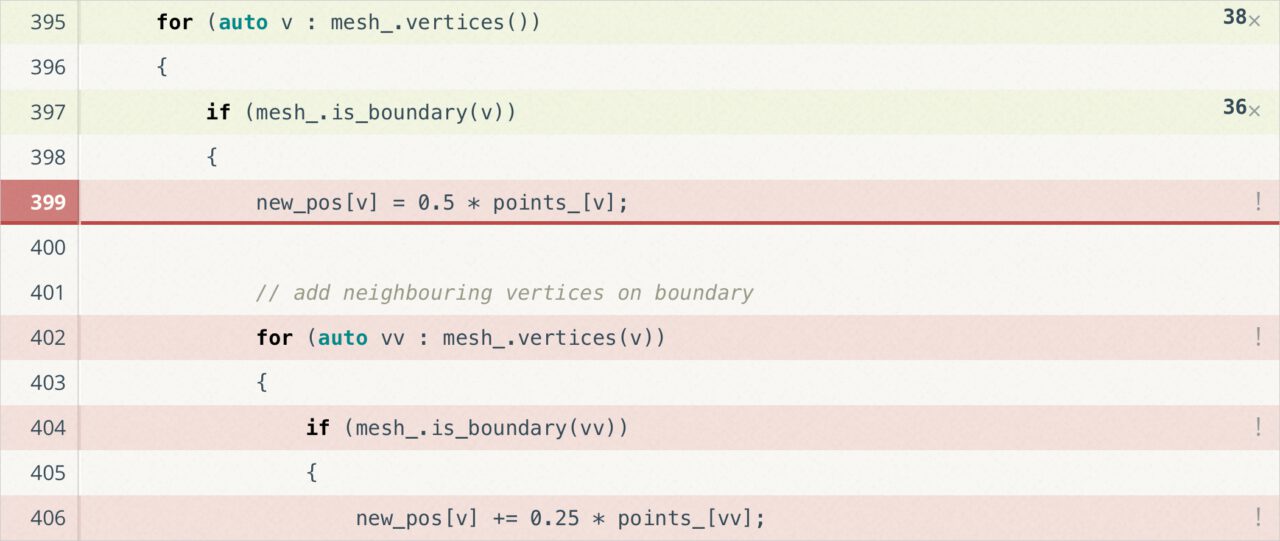
This allows you to locally browse through your code base and check which parts are covered (light blue) and which not (orange).
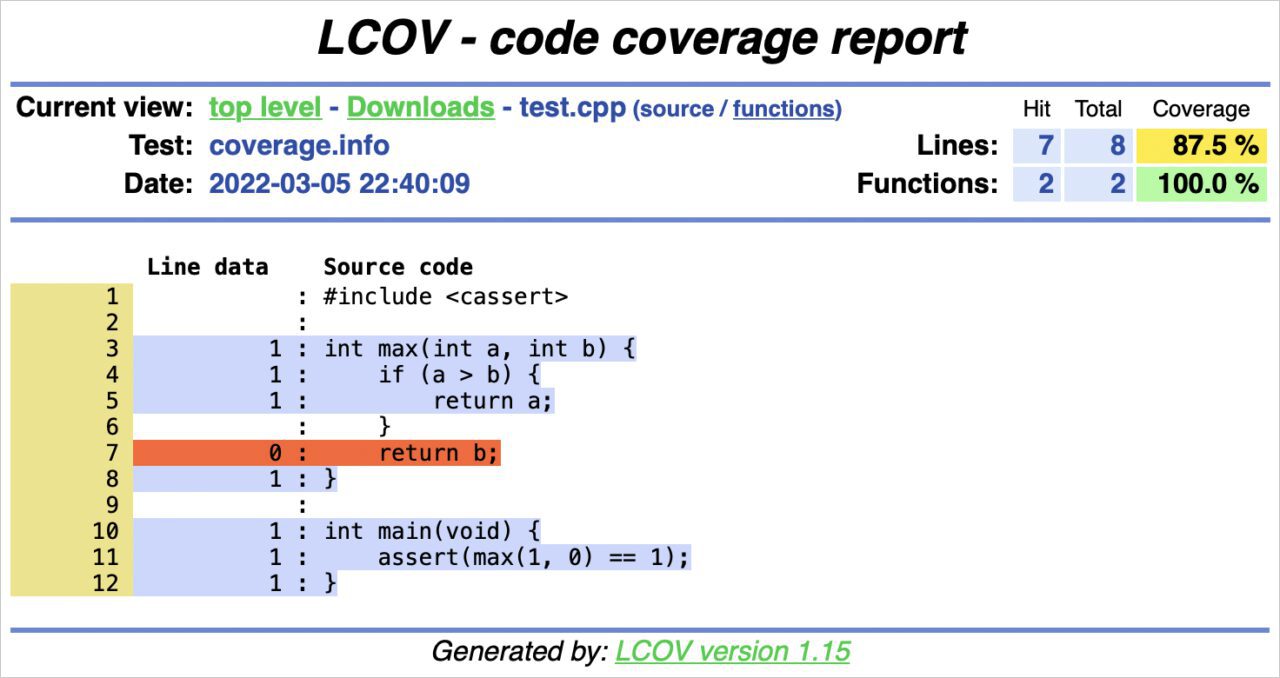
Note that I’m showing the version for the lower coverage rate here.
CMake Integration
For convenience, you can integrate the report generation directly into your build system. Here’s a basic CMakeLists.txt file that adds a custom coverage target to run lcov and genhtml:
cmake_minimum_required(VERSION 3.6)
project(coverage-example)

if(ENABLE_COVERAGE)
  # set compiler flags
  set(CMAKE_CXX_FLAGS "-O0 -coverage")

  # find required tools
  find_program(LCOV lcov REQUIRED)
  find_program(GENHTML genhtml REQUIRED)

  # add coverage target
  add_custom_target(coverage
    # gather data
    COMMAND ${LCOV} --directory . --capture --output-file coverage.info
    # generate report
    COMMAND ${GENHTML} --demangle-cpp -o coverage coverage.info
    WORKING_DIRECTORY ${CMAKE_BINARY_DIR})
endif()

add_executable(test test.cpp)
Configure and build the project with the ENABLE_COVERAGE option:
cmake -DENABLE_COVERAGE=true .. && make
Now you can run the executable and generate the HTML report:
./test && make coverage
Continuous Integration
You can take coverage testing one step further and directly integrate it into your continuous integration (CI) pipeline. This is useful for checking how the coverage rate evolves and to make sure it does not decrease as you integrate new features into your project.
In this example, I’m using GitHub Actions for integration builds and the Coveralls web service to visualize results.
Here is an example for a GitHub workflow that builds and runs the example project from above and uploads the coverage results to Coveralls:
name: coverage
on: push
env:
  BUILD_TYPE: Debug
jobs:
  coverage:
    runs-on: ubuntu-latest

    steps:
      - uses: actions/checkout@v2

      - name: Install dependencies
        if: runner.os == 'Linux'
        run: sudo apt-get install -o Acquire::Retries=3 lcov

      - name: Create build directory
        run: cmake -E make_directory ${{runner.workspace}}/build

      - name: Configure CMake
        shell: bash
        working-directory: ${{runner.workspace}}/build
        run: cmake $GITHUB_WORKSPACE -DCMAKE_BUILD_TYPE=$BUILD -DENABLE_COVERAGE=true

      - name: Build
        working-directory: ${{runner.workspace}}/build
        shell: bash
        run: cmake --build . --config $BUILD_TYPE

      - name: Run
        working-directory: ${{runner.workspace}}/build
        shell: bash
        run: ./test

      - name: Coverage
        working-directory: ${{runner.workspace}}/build
        shell: bash
        run: make coverage

      - name: Coveralls
        uses: coverallsapp/github-action@master
        with:
          path-to-lcov: ${{runner.workspace}}/build/coverage.info
          github-token: ${{ secrets.GITHUB_TOKEN }}
If you are curious what the result looks like for a real-world project, check out the Coveralls page for our mesh processing library.
Bottom Line
Code coverage testing is a tremendously useful tool that I regularly use during development. When writing new code, it gives me confidence that my tests are doing what I think they do. However, I find it particularly useful when bringing legacy code under test. The coverage information guides me which tests to write until I reach sufficient coverage for that code.
Beware though that using code coverage as a quality metric can be misleading. High coverage is not a goal in itself. It’s a means, not an end. The fact that there is a test triggering your code does not guarantee you anything about wether the test does something meaningful at all.
Give code coverage a try. I bet that once you experience the benefit of having coverage information available you don’t want to miss it form your development toolbox.
☞ Subscribe for updates on new blog posts.